Study Tips for Science
Heyyy welcome back! This week we’re doing a follow up blog .Since science is one of the hardest subjects to study for I’ll be giving you a few tips on how to study for your science exam.
Enjoy
One
Firstly you need to start studying at least a week or two in advance because even though everything can’t come out in the paper we’re not sure what will and what won’t meaning there’s a lot to get through. Studying in advance will help you study without burning out or cramping all the information and not being able to remember anything. While studying in advance is helpful you also don’t want to study to in advance because then you forget a lot of the work and still end up doing badly.
Two
Now that you’ve set time to study you need to know what to study and how so in this section I’ll be discussing 2 important tips on studying.The first one is study new work first.When I say this I mean you’ve obviously study some of the work for your basic tests so when it comes to exams study the new work first and then come to the old work because that will feel more like revision since you’ll remember majority of the information. The second tip is study definitions, in science definitions are very important. If you know your definitions chances are you’ll understand the work better and you’ll be able to answer a lot of the questions in your exam so make sure to know all your definitions
Three
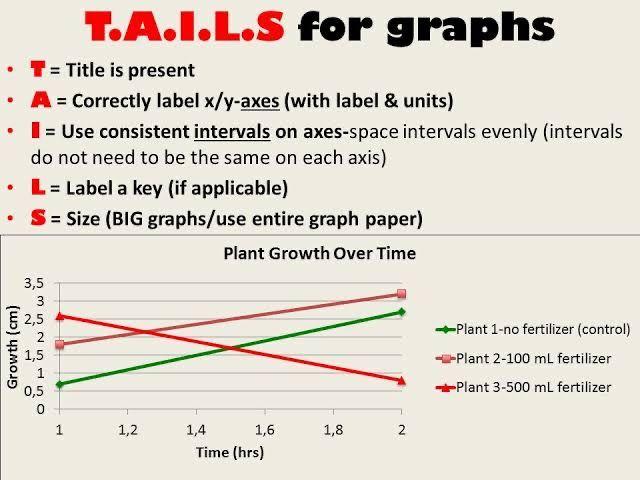
Once you know you’re definitions make sure to learn how to draw a bar graph and a lone graph. This will help you up till metric because you are always asked to draw a graph and graphs are worth a lot of marks. A few basic tips about graphs are:
· Always have a heading
· Label your x and y axis
· Accurate measurements
· Correct information
. Size

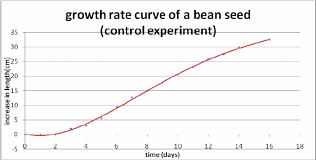
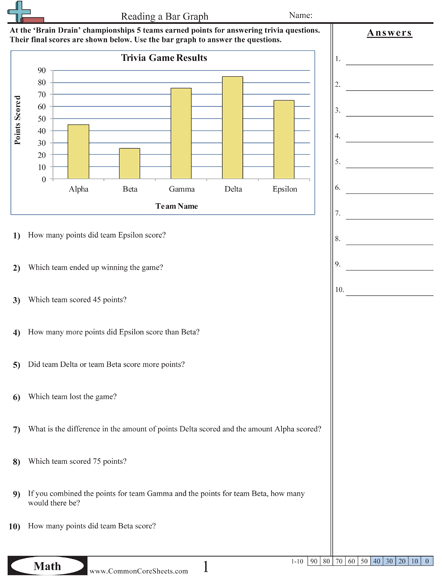
Now I’m going to go through all of these in detail because it is one of the most important parts of science exams let’s start with having a heading. Now you must be wondering how do I know what my heading is well it’s simple really the information is usually tabulated and you just need to put it above a graph and add the words bar graph showing….. or line graph showing…… here’s some examples of , line graphs and bar graphs


Secondly labelling the x and y axis doesn’t mean writing x and y axis it means writing the dependent variable on the y axis and the independent variable on the x axis along with the unit measurements used to measure the variables
Thirdly always make sure you have the right measurements that you leave one centimetre spaces between your bars and that the numbers and one centimetre apart. You also need to make sure you find the right number pattern so that you can fit all the necessary numbers in your graph
You also must make sure you take down all the information.
Lastly make sure that it’s big enough but not too big and you use the whole page.
Four
Lastly make sure to leaner everything. There’s a lot to know in science and once you know your definitions it will become easy to learn while not everything can come out in the exam you don’t know what will therefore you must study everything. The only thing that can help you here is to try your best to understand the work and to learn all the diagrams and hopefully you’ll do well
Little not from me
I hope you found this helpful and it will make studying easier. Good luck with exams !
If you have any questions you can email me at adiaryofanoverthinker@gmail.com
until next week
byeee <3
